

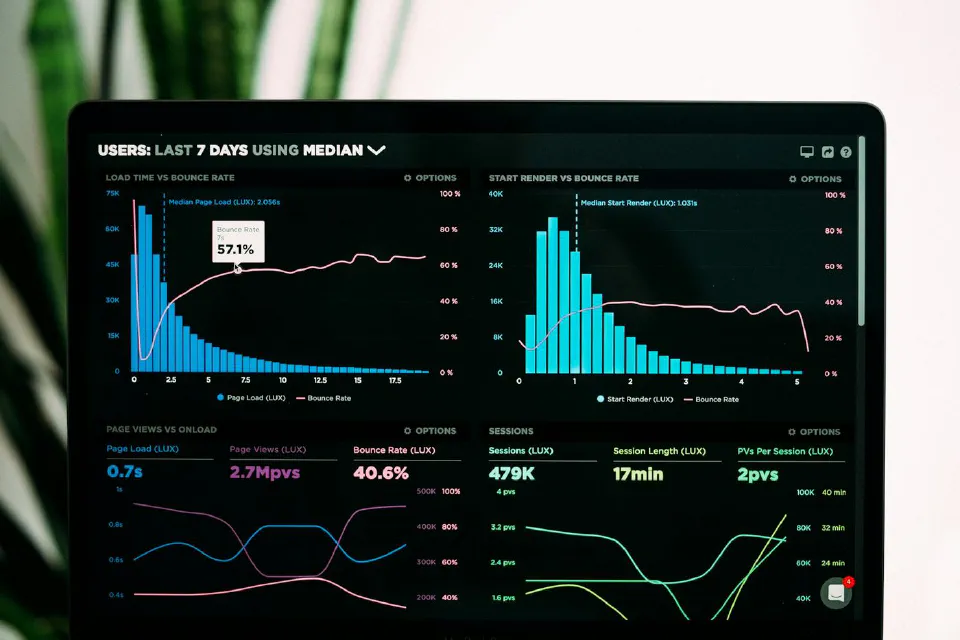
After a release, someone reports that an action occasionally fails. Your team needs more than an approximate time to investigate: the affected code, the version and the context of the error. This article, published on 18 July 2026, describes how MainPath makes that information accessible through your own Sentry connection.
Connect your account and enable the component
MainPath handles setup for your project once you have added your own Sentry connection and enabled Sentry for the component you want to monitor. Error tracking stays disabled until you complete those steps. Error data lives in your Sentry organisation, using either Sentry Cloud or an instance you operate yourself.
Add the account under Connections. Then select the app, homepage or backend in your project and enable Sentry under Features. You also choose which Sentry project should receive errors from that component. The error tracking guide describes the current setup steps.
From the project to the error details
The version presented here shows production errors directly inside MainPath, filtered by repository. Each entry carries a stack trace, release and context. When your organisation runs several applications, this keeps errors associated with the project you are working on.
A link opens the detail view in Sentry for further investigation. Your team can examine the error there and decide which code change is needed. Error tracking provides the information for that work.
Use your platform account in your Sentry organisation
After you connect Sentry, MainPath sets up single sign on into your Sentry organisation. Team members use their existing platform account there, with email and password or a passkey. A link in their profile leads to the organisation’s sign in page. Sentry remains in your own account or on your own instance.
Use releases to narrow the investigation
Each error carries the version in which it occurred. If an issue first appears after a particular release, your team can start by reviewing the changes in that version. Timing alone does not establish the cause, but it gives the investigation a concrete starting point.
After a fix, check whether the issue occurs again in the new version. Frequency and the time of the latest occurrence help you assess it. Working with Sentry explains how to read those details.
What was still planned in July 2026
At the time this article was published, infrastructure monitoring had been announced. Server health and the corresponding dashboard data were still planned additions to the operating tools described here. This article covers application error tracking with Sentry.
Connect your first component
Start with the application whose errors your team wants to investigate. Connect your Sentry account, enable tracking for that component and open its Sentry project. After the next release, you can check which issues occur in the new version.